Skald's Pages.

Java 性能分析之 Arthas 火焰图

Word count: 1.1kReading time: 4 min
2020/10/16 Share

为什么要做性能分析

很多场景的 Java 应用中 IT 成本中 CPU 成本常常是成本的大头,如果能够有效优化 Java 应用的 CPU 占用,可以较好降低成本,提升程序响应速度。
Java 性能分析分为两部分

  • 业务性能:某些的业务代码引起的性能瓶颈
  • JVM 性能调优:JVM 设置存在优化

本文主要关注业务代码的热点问题。

Arthas 是什么?

Arthas 是Alibaba开源的Java诊断工具,深受开发者喜爱。

官方文档 源码地址

当你遇到以下类似问题而束手无策时,Arthas可以帮助你解决:

  • 这个类从哪个 jar 包加载的?为什么会报各种类相关的 Exception?
  • 我改的代码为什么没有执行到?难道是我没 commit?分支搞错了?
  • 遇到问题无法在线上 debug,难道只能通过加日志再重新发布吗?
  • 线上遇到某个用户的数据处理有问题,但线上同样无法 debug,线下无法重现!
  • 是否有一个全局视角来查看系统的运行状况?
  • 有什么办法可以监控到JVM的实时运行状态?
  • 怎么快速定位应用的热点,生成火焰图?

本文主要介绍如何利用 profiler 命令来定位应用热点,从而优化应用的性能。

为什么选择 Arthas 来做火焰图?

Arthas 无需代理模式启动应用,通过 Attach 进程方式即可实现 Java 应用的诊断与性能分析。
详细可以参考:Arthas 原理分析

Java 火焰图在 Netflix 的加持下,逐渐成熟, async-profile 出现后进一步降低了对 Java 火焰图的分析步骤。

Arthas 在 3.1.5 版本开始支持 async-profile, 无需配置,快速实现 profile 分析。

使用 Arthas 生成火焰图

安装和启动 Arthas

全量安装
arthas 是一个 jar 包,下载后直接运行即可,然后执行相应命令。

1
2
3
4
5
6
7
8
9
10

mkdir arthas; cd arthas;

# 全量安装
wget https://arthas.aliyun.com/download/latest_version?mirror=aliyun -O arthas.zip
unzip arthas.zip

# 非全量安装
curl -O https://arthas.aliyun.com/arthas-boot.jar
java -jar arthas-boot.jar

创建火焰图

启动 arthas 后,attach 到实际的进程

1
2
3
4
5
6
7
8
9
10
11
12
13
14
15
16
17
18
19
20
21
22
23
➜  arthas java -jar arthas-boot.jar
[INFO] arthas-boot version: 3.4.3
[INFO] Found existing java process, please choose one and input the serial number of the process, eg : 1. Then hit ENTER.
* [1]: 4541
1
[INFO] arthas home: /Users/yzz/.arthas/lib/3.4.3/arthas
[INFO] Try to attach process 4541
[INFO] Attach process 4541 success.
[INFO] arthas-client connect 127.0.0.1 3658
,---. ,------. ,--------.,--. ,--. ,---. ,---.
/ O \ | .--. ''--. .--'| '--' | / O \ ' .-'
| .-. || '--'.' | | | .--. || .-. |`. `-.
| | | || |\ \ | | | | | || | | |.-' |
`--' `--'`--' '--' `--' `--' `--'`--' `--'`-----'


wiki https://arthas.aliyun.com/doc
tutorials https://arthas.aliyun.com/doc/arthas-tutorials.html
version 3.4.3
pid 4541
time 2020-10-17 13:14:03

[arthas@4541]$

注意: 输入前面的序号 1 不是 724

使用 profiler 命令

1
2
3
4
5
6
7
8
9
10
11
12
# 启动
[arthas@4541]$ profiler start
Started [cpu] profiling

# 查看运行状态
[arthas@4541]$ profiler status
[cpu] profiling is running for 13 seconds

# 停止
[arthas@4541]$ profiler stop --file /tmp/output.svg
OK
profiler output file: /tmp/output.svg

本机可以通过 http://localhost:3658/arthas-output/ 直接查看结果
也可以通过 Chrome 打开 output.svg 文件

Flame-1

点击某个函数调用栈可以看到放大局部的调用栈,最新 3.28% 是 CPU 占比。
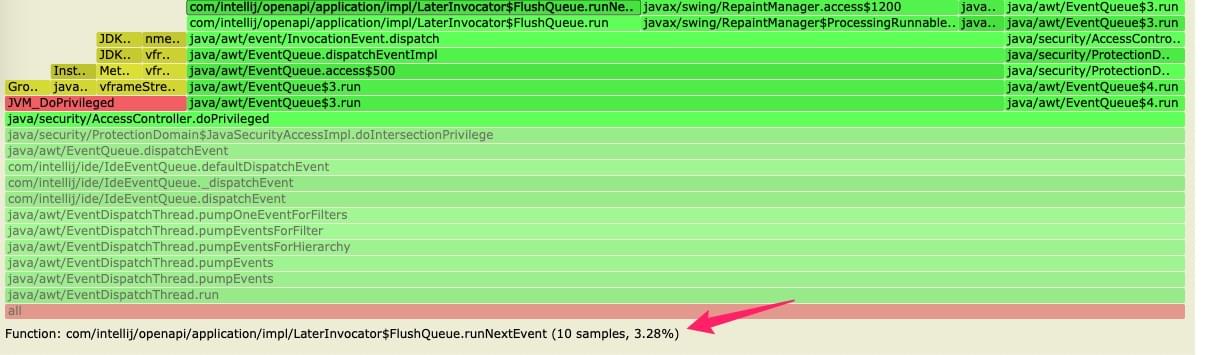
Flame-2

点击 all 返回默认的全局展示。

容器内使用

由于 k8sperf_event_open 默认是未开启的状态,在容器内使用会有权限问题。

观察日志会发现:

1
perf_event_open failed: Permission denied

此时可以使用 itimer 事件来采样,此事件与 cpu 采样类似,但是不需要 perf_events 支持,缺点是无法统计内核的堆栈性能。通过 --event 可以指定

1
2
3
# 使用 itimer 采样
[arthas@4541]$ profiler start --event itimer
Started [cpu] profiling

其他问题可以参考:async-profiler#troubleshooting
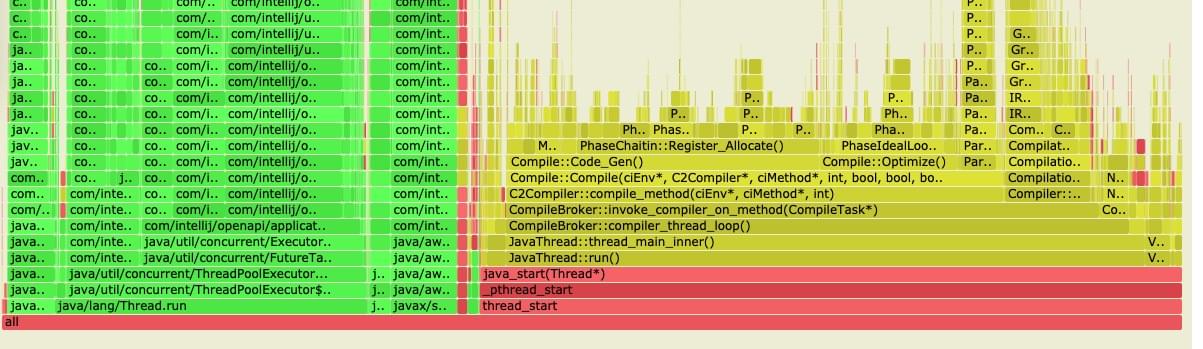
看懂火焰图

Flame Graphs: How to Read

Y 轴表示调用栈,每一层都是一个函数。调用栈越深,火焰就越高,顶部就是正在执行的函数,下方都是它的父函数。

X 轴表示抽样数,如果一个函数在x轴占据的宽度越宽,就表示它被抽到的次数多,即执行的时间长。注意,x轴不代表时间,而是所有的调用栈合并后,按字母顺序排列的。

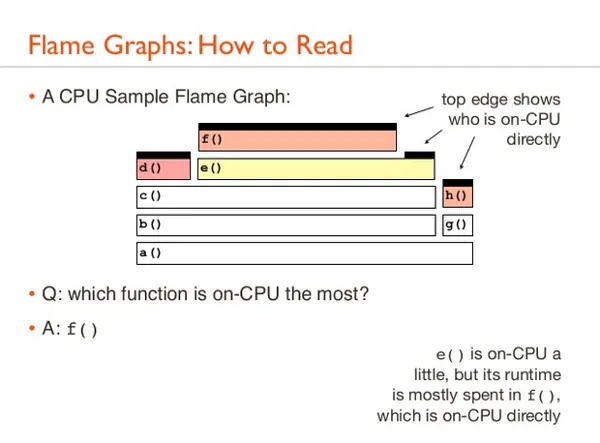
火焰图就是看顶层的哪个函数占据的宽度最大。只要有平顶 (plateaus),就表示该函数可能存在性能问题。

颜色没有实际意义,只是随机选取用于栈帧之间相互区分,左右顺序也没有什么含义。

CATALOG
  1. 1. 为什么要做性能分析
  2. 2. Arthas 是什么?
  3. 3. 为什么选择 Arthas 来做火焰图?
  4. 4. 使用 Arthas 生成火焰图
    1. 4.1. 安装和启动 Arthas
    2. 4.2. 创建火焰图
      1. 4.2.1. 启动 arthas 后,attach 到实际的进程
      2. 4.2.2. 使用 profiler 命令
      3. 4.2.3. 容器内使用
  5. 5. 看懂火焰图